 Our Latest Work
Our works spanning from Web, mobile app, maintenance works, in-house projects and IT Services like consulting and testing.
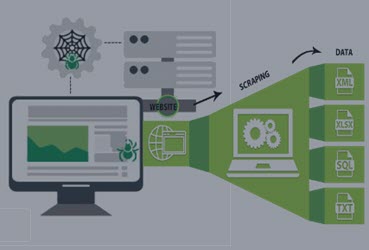
- Extract data from dynamic pages.
- Large bulk scraping
- Export scraped data as CSV.
- Import, Export sitemaps.
- JS rendering (Headless Chrome)
Add-on to scrape data
Data scraping, also known as web scraping, is the process of importing information from a website into a spreadsheet or local file saved on your computer. It's one of the most efficient ways to get data from the web, and in some cases to channel that data to another website.

- Pipeline forecasting tool
- Context database architecture
CRM-Loyalty
Loyaty is an external module to integrate with CRM via API hookup, in which RFM model (Recency, Frequency, Monetary) is core to this business case.
- Add unlimited notes to a checkbox
- Define custom multi-statuses checkbox
- Add the tracker to the checkbox
Smart Checklist
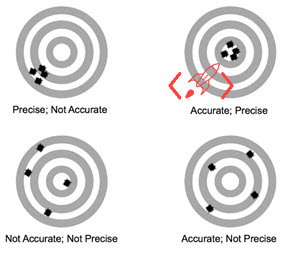
Learn more: What's the difference in accuracy and precision?
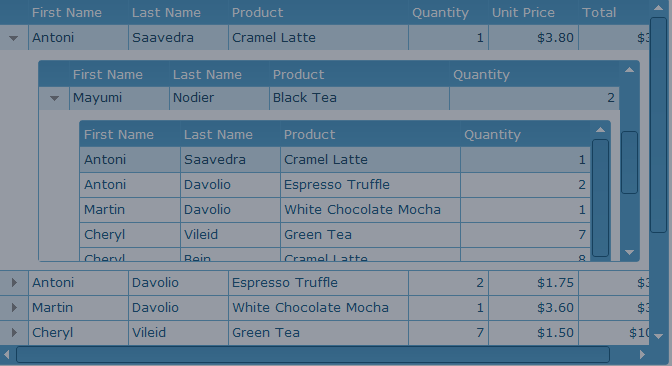
- Visible grids and nested grids
- Load the data of nested grids on demand
- Freeze the heading rows of nested grids
- Merge multiple columns into one, turn the merged cells into multi-lines data cell.
Smart Grid

- Change the modifiabletexts
- Protect the non-modifiable built-in texts
- Log the text changes
Region-based Localization
Develop the localization engine to localize texts as per each tenant's desire (region-based localization). Teant Admin can modify the orginal text for each label, button text etc. The localized data is stored in Database so the up-and-running GUI texts can be editted 'on the fly' and the settings are applied immediately.

- Change the modifiabletexts
- Protect the non-modifiable built-in texts
- Log the text changes
Tracking Employee Growth
Learn more: What is 360 Degree Feedback?
A SMART goal is used to help guide goal setting. SMART is an acronym that stands for Specific, Measurable, Achievable, Realistic, and Time-bound. Therefore, a SMART goal incorporates all of these criteria to help focus your efforts and increase the chances of achieving that goal.
Ideally speaking, each corporate, department, and section objective should be:
- Specific: target a specific area for improvement.
- Measurable: quantify or at least suggest an indicator of progress.
- Assignable: specify who will do it.
- Realistic: state what results can realistically be achieved, given available resources.
- Time-bound: specify when the result(s) can be achieved.
Learn more: What is SMART criteria?

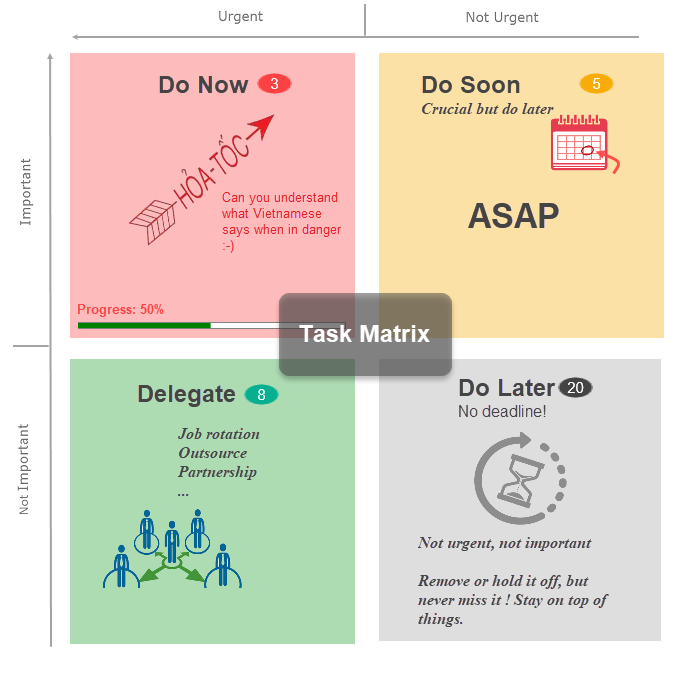
- Organize data in Kanban and Task-matrix
- Drag/drop and pushpin task
- Archire tasks into Time Capture
- Review the low tasks indiscriminately
- Automatically switch low tasks to high tasks at the scheduled time
Lean Task Tracking
Learn more: What is Priority Matrix?

- Simple and lean quiz settings
- Define quiz set with custom attributes
- Add stats data into the quiz responses
Quiz Portal for
BA
A business analyst (BA) is someone who analyzes an organization or
business domain (real or hypothetical) and documents its business or
processes or systems, assessing the business model or its integration with
technology. Business Analyst helps in guiding businesses in
improving processes, products, services and software through data analysis.
Learn more: What is Business Analyst?
Training
business domain (real or hypothetical) and documents its business or
processes or systems, assessing the business model or its integration with
technology. Business Analyst helps in guiding businesses in
improving processes, products, services and software through data analysis.
Learn more: What is Business Analyst?
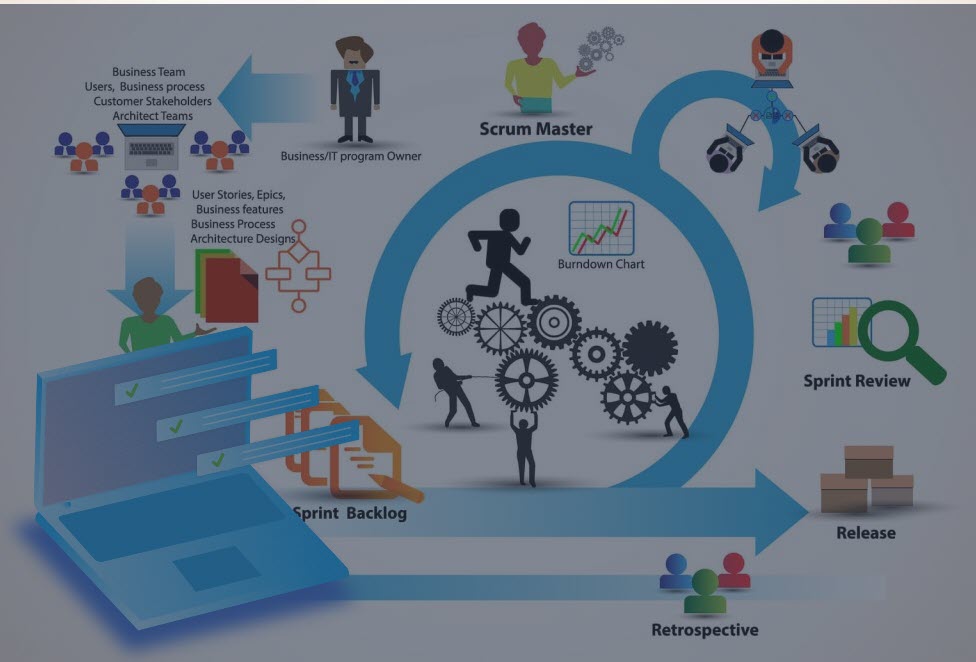
Learn more: What is Rolling-wave planning?
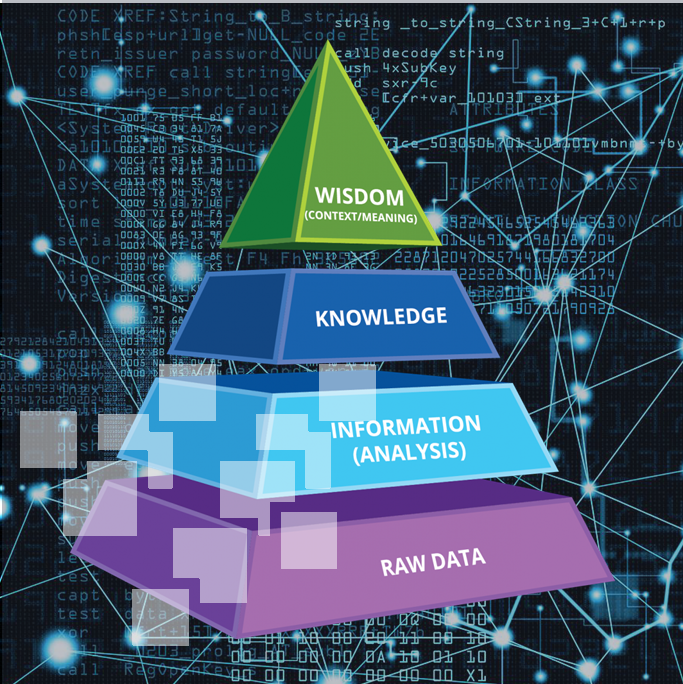
- Auto tag the content with similiar key-phrases
- Auto scan for the key-phrases
- Suggest the new key-phrases based on frequency and relevance
- Convert data into information using RFM Model
- Aggregate data and transform to knowledge base
Affinity Engine
Taxonomy BPO now applies to the computer science, as well. WordPress is the pioneer in adopting this term in data structure.
A taxonomy within WordPress is a way of grouping posts and custom post types together based on a select number of relationships. By default, a standard post will have two taxonomy types called Categories and Tags which are a handy way of ensuring related content on your website is easy for visitors to find. You can register a new custom taxonomy called Topics.
Folksonomy is a powerful tool when lots of users all add tags to a single piece of information. Companies can use data about what users are adding to come up with better ways to structure content, and so help them find what they're looking for. It's also scalable and fast to use.
Folksonomy and taxonomy are both methods that are commonly used to organize and label data and digital content, often through tags. But while they both try to solve the same issue, there are major differences between the two in how they deal with this information.
Learn more: What's the Difference Between Folksonomy and Taxonomy?
Learn more: The Power of Progressive Disclosure
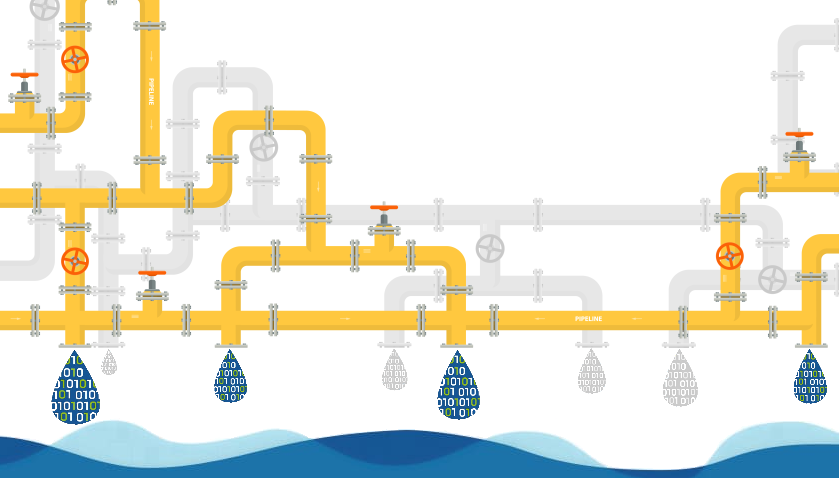
- Increase data quality with the enhanced classification
- Classify data based on similiar patterns of key phrases
- Convert data into information or knowledge base
SDP (Smart Data Pipeline)
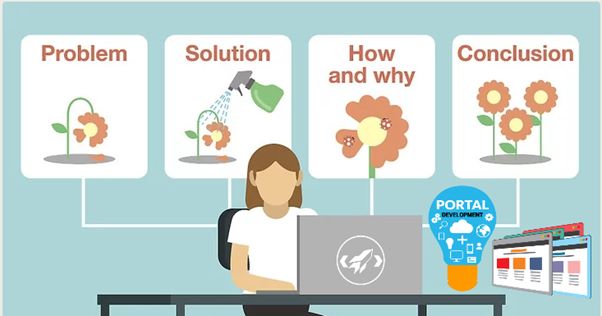
- Social tools for tracking user behaviors
- Multiple views for news: Flat View, Photo News, Progressive Disclosure,
- Integrate with Google Suite
Enhanced Tools for Portal
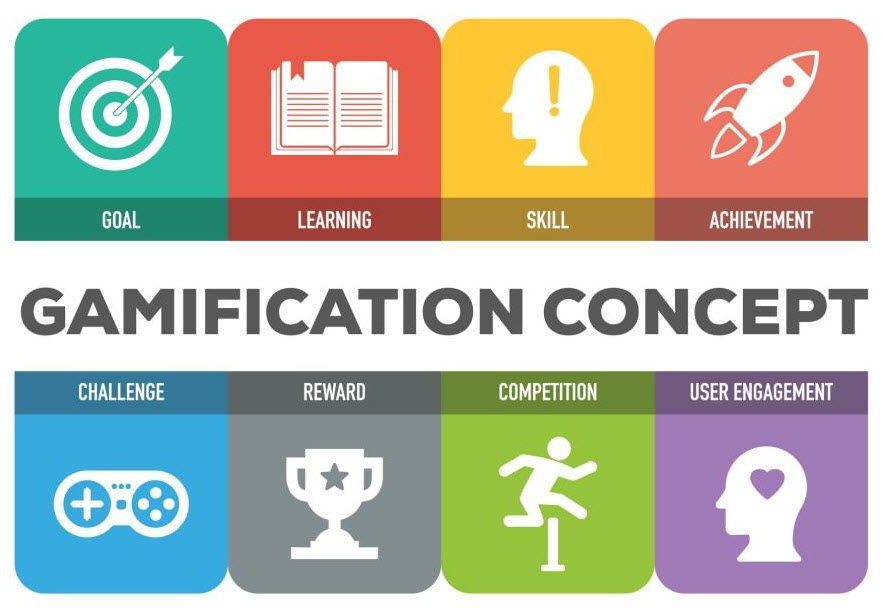
- Daily gameshow-based quiz set for training the staff (HRM, CRM)
- Point-based score for interaction activities and frequency
- Offer badge for most active users
Gamification for business software
Gamification, by definition, is a way of engaging people in fun activities that provide some of the compelling elements of games into other activities to provide information on products or services. For example, end users of Accounting system has to interact with the boring spreadsheet in every single day. The repetitive tasks is a source of mistakes even the large portion of tasks have been automated. It's not enough. End users don't want to stick to boring tasks for more than 1 hour without any award or motivation. Design the point system and badge will help end users feel relaxed and motivational. These point scores are also a good input for running KPI in quarter-end or year-end. A stone kills 2 birds!
Find out about gamification, check it out at: What is Gamification?
